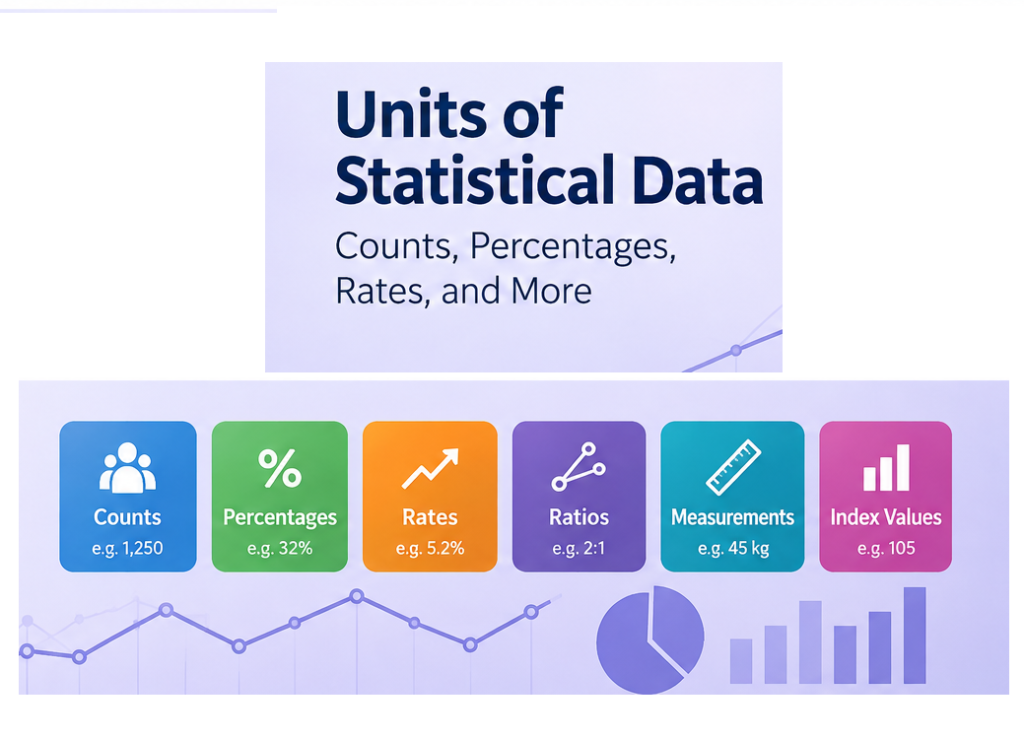
A statistical unit tells us how a numerical value should be interpreted. While units are often associated with physical measurements such as meters or kilograms, statistical data can also be expressed using counts, percentages, rates, ratios, and other forms of measurement.
Understanding these units is essential when reading tables, charts, surveys, reports, and datasets.
A number without its statistical context can easily be misunderstood. For example, «20» could mean 20 people, 20%, 20 dollars, or 20 units of a product.
Counts
A count represents the number of individuals, objects, events, or observations.
Examples include:
- Number of students: 2,500
- Number of employees: 850
- Number of households: 12,000
- Number of accidents: 145
Counts are often expressed as whole numbers, although some statistical processes can involve estimated counts.
Counts are particularly useful when measuring the size of a population or the frequency of an event.
Percentages
A percentage expresses a value as a proportion of 100.
For example, if 30 out of 100 survey respondents select a particular answer, the result can be expressed as:
30%
Percentages make it easier to compare groups of different sizes.
For example, comparing 50 people with a characteristic in a population of 100 people is very different from having 50 people with the same characteristic in a population of 10,000 people. Percentages provide additional context.
Rates
Rates describe the occurrence of an event relative to a population, period, or another reference quantity.
Examples include:
- Birth rate
- Unemployment rate
- Crime rate
- Growth rate
- Mortality rate
A rate usually includes a denominator or reference population. For this reason, it should always be interpreted together with the definition used to calculate it.
Ratios
A ratio compares two quantities.
For example, a ratio of 2:1 indicates that one quantity is twice the size of another.
Ratios can be useful for comparing populations, financial values, demographic characteristics, or other measurable quantities.
Unlike percentages, ratios do not necessarily use 100 as their reference base.
Averages and Measurement Units
Statistical averages retain the unit of the original variable.
For example, if the heights of a group of people are measured in centimeters, the mean height will also be expressed in centimeters.
Similarly, if income is recorded in dollars, the average income is expressed in dollars.
This principle is important when interpreting statistical results because the unit provides essential information about what the number represents.
Index Numbers
Index numbers are statistical measures designed to compare values relative to a reference period or value.
A common approach is to assign a base value of 100 to a reference period.
For example:
- Base year: 100
- Following year: 105
An index value of 105 indicates that the measured value is 5% higher than the reference value, assuming the index is constructed in the standard way.
Index numbers are commonly used in economic statistics, price analysis, and other areas where changes over time need to be summarized.
Units in Statistical Tables
When presenting statistical data in a table, the unit should be clearly identified.
For example:
| Indicator | Value | Unit |
|---|---|---|
| Population | 250,000 | People |
| Average income | 42,500 | USD |
| Unemployment | 6.2 | % |
| Average age | 34.5 | Years |
Clearly labeling units makes statistical tables easier to interpret and reduces the possibility of confusion.
Units in Charts and Graphs
The same principle applies to statistical charts.
An axis should indicate the relevant unit whenever necessary. For example:
Population (millions)
or
Average income (USD)
or
Growth rate (%)
This small detail can significantly improve the clarity of a visualization.
Choosing the Correct Statistical Unit
The appropriate unit depends on the question being answered.
If the goal is to determine how many individuals are affected, a count may be appropriate. If the goal is to compare groups of different sizes, a percentage or rate may provide more useful information.
For example, reporting that 1,000 people in two different cities experienced an event does not provide the same context as reporting the percentage of each city’s population affected.
The choice of unit should therefore reflect the purpose of the analysis.
Conclusion
Statistical data can be expressed through many different units, including counts, percentages, rates, ratios, physical measurements, and index numbers.
Understanding these units is essential for interpreting statistics correctly. When working with data, always check what the number represents, what its reference population or measurement is, and which unit is being used.